RitmoForceCurve
RitmoForceCurve utilizes two motion sensors attached to an oar to provide live force curve and oar motion feedback.
Using the difference in motion between the two sensors on the oar, it captures the oar bend during the drive and uses this for the force curve. It also captures the overall motion of the oar for the entire stroke.
The two sensors attach to the oar with Velcro and connect to the iOS app via Bluetooth.
The RitmoForceCurve system is made to be easy in every way possible to get insight on the motion of your oar and power application.
The iOS beta is distributed through Apple TestFlight.

Sensor Setup & Calibration Guide
Introduction
The RitmoForceCurveâ„¢ Sensor System measures real-time oar force, motion, and stroke dynamics to deliver precise performance feedback for rowers. Designed for durability and accuracy, each Bluetooth-enabled sensor captures high-resolution force curves and stroke timing, syncing seamlessly with the RitmoForceCurve mobile app. This guide provides setup, calibration, and troubleshooting instructions to ensure optimal sensor alignment and reliable on-water data collection.
Download the TestFlight iOS Beta app
Included Components (per sensor)
|
· ritmoForceCurve Sensor |
|
||
|
· Silicone Band |
|
||
|
· Mounting Bracket |
|
||
|
· Rubber under pad |
|
||
|
· Velcro or Silicone Strap |
|
 Figure 1
 Figure 2
 Figure 3
 Figure 4
 Figure 5
 Figure 6
Assembly Instructions
1. Seal the sensor: The silicone wedding band seals the sensor from water at the USB-C port and seam. Invert it so the flat smooth side contacts the sensor. Wrap it around the sensor as shown below.
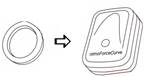 Figure 7
2. Mount the sensor: Insert the sensor (with band) into the plastic mount bracket. Ensure the button faces away from the curved underside. Verify the band has not shifted off the port or seam.
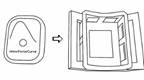 Figure 8
3. Pad the oar: Place the neoprene pad between the bracket and the oar shaft. It adds friction and protects the oar.
 Figure 9
  Figure 10
4. Secure with Velcro* or silicone* strap: Secure the bracket to the oar using the Velcro or silicone strap. Tighten firm enough to prevent slip from a forceful finish feather motion. The bracket curvature is sized to fit all oars with the extremes being standard sweeps and skinny shaft sculls.
|
|
|
|
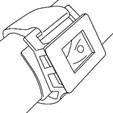
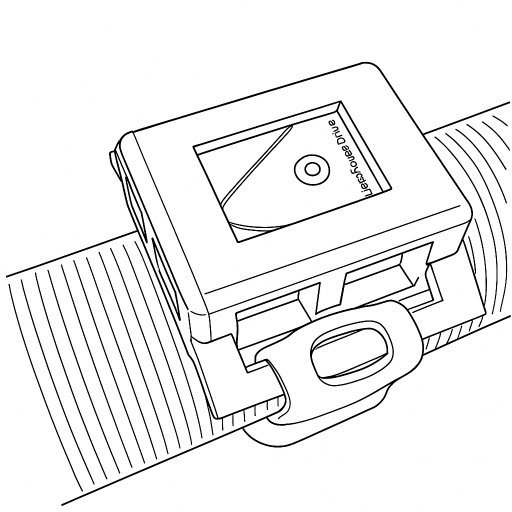 Figure 12
*We are currently evaluating strap material options, including Velcro and silicone, and expect to finalize our selection by early 2026.
Sensor Orientation
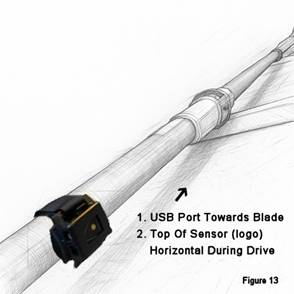 Figure 13
- Correct sensor orientation is important, but not critical due to on-water calibration. The USB-C port and text ritmoForceCurve needs to face the blade end (Figure 13).
- During the drive, the sensor button should be horizontal, during recovery, vertical (Figures 14 & 15). Mount the sensor this way before launch.
- Recommended sensor positions:
- Sensor 1: Between the handle and the button.
- Sensor 2: Roughly two-thirds of the way from the button to the blade.
|
|
|
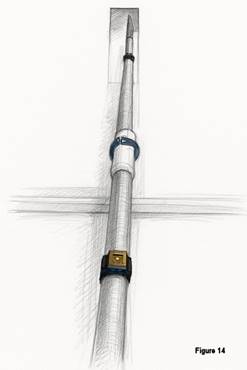 Figure 14
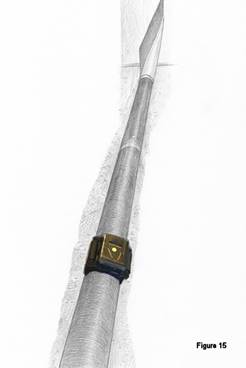 Figure 15
Connecting & Calibration
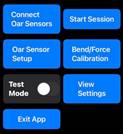 Figure 16
Connecting the Sensors:
- Turn on both sensors before placing the oars in the oarlocks or pushing off from the dock.
- Open the app → Main Menu → Connect Oar Sensors.
 Figure 17
- Tap Turn on scanning for surrounding devices.
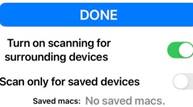 Figure 18
- If pairing for the first time, disable Scan only for saved devices.
- Select both sensors (they’ll appear by MAC address), then tap DONE.
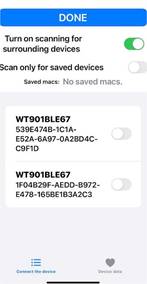 Figure 19
Oar Sensor Setup
- After sensors are connected go to Oar Sensor Setup
- Choose port or starboard.
- To check Sensor alignment, place oar blade face up on level floor with something between the back of the sleeve and the floor that keeps the back of the sleeve parallel to floor (Figure 20).
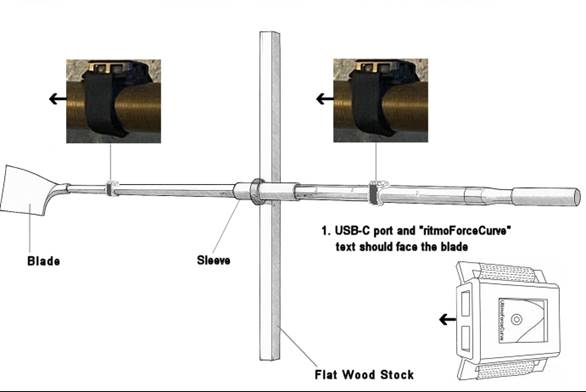 Figure 20
- Check to make sure angles for both sensors are within -5 to 5 deg. Adjust if necessary. The app auto calibrates while you are rowing but needs them to be reasonably close.
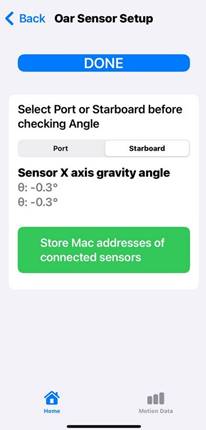 Figure 21
|
|
|
Bend Force Calibration
This setting scales Watts and powerSplit but doesn’t affect:
- Max bend
- Force curve shape
- Stroke length
- Catch or Finish miss values.
Bend varies with sensor distance and oar stiffness. For now, adjust the value until powerSplit looks correct. In future updates, we’ll provide notes on how to calibrate using HR and steady-state watts.
 Figure 22
Troubleshooting Table
|
Issue |
Possible Cause |
Solution |
|
Sensor not detected |
Bluetooth off |
Turn on sensor / enable Bluetooth |
|
Data spikes |
Loose bracket |
Check Velcro strap / reposition pad |
|
Bend reading inaccurate |
Misaligned sensor |
Adjust orientation / recalibrate |
Oar Kit Videos
Oar Kit videos open in a new browser tab.
-
How to mount sensors on the oar
Step-by-step overview of mounting the sensors and connecting them for use on the water.
Oar Kit Videos
Short setup videos for mounting and using the RitmoForceCurve oar sensors.
How to mount sensors on the oar
Step-by-step overview of mounting the sensors and connecting them for use on the water.
Open videoThis video link is also listed at the bottom of the Oar Kit instructions page.
Mobile App
The RitmoForceCurve mobile app connects to the oar sensors, displays live rowing data, and stores workout data for later review and cloud analysis.
iOS app and Android recording
RitmoForceCurve currently has an iOS app. Android users can still record data from the WitMotion sensors using the WitMotion Android app, then use exported data for later analysis workflows.
Android recording instructions Download WitMotion on Google Play
What this section covers
- Connecting Oar Sensors — how to pair and select the Bluetooth oar sensors.
- Android Recording — how Android users can record WitMotion sensor data while the RitmoForceCurve app remains iOS-only.
- Workout & Auto Timer Settings — how the workout settings and Auto Piece Timer affect workout summaries and detected pieces.
- Sensor Mount / Oar Calibration — how to check sensor mounting and how Scale Factor is selected, edited, shared, and created from a measured oar setup.
- Sharing Views, Settings & Calibrations — how to pass custom views, workout settings, and oar calibrations to another rower or device.
- Creating Custom Views — how to create live data screens with the metrics you want to see.
Placeholder: add screenshots of the main app menu and a short overview of the typical workout flow.
Android Recording with the WitMotion App
RitmoForceCurve currently has an iOS app. Android users can still record data from the WitMotion oar sensors using the WitMotion app. After recording, upload the saved WitMotion text file or zipped recording folder for Cloud Analysis.
Learn about Cloud Analysis Open Cloud Analysis Download WitMotion on Google Play
Before you start
- Turn on phone Bluetooth and approve any Bluetooth/location permissions Android requests.
- Charge and turn on both WitMotion sensors before opening the connection screen.
- Connect sensors inside the WitMotion app, not from the phone’s normal Bluetooth settings.
- Before using the sensors at a busy dock, connect them at home once and note the visible sensor names/addresses. The last 4 characters are usually enough to tell which sensors are yours.
You do not need to memorize which sensor is “shaft” or “sleeve” while pairing in the WitMotion app. The main reason to note the sensor IDs is to avoid accidentally connecting to someone else’s WitMotion sensors when several are nearby.
Screen-to-screen path
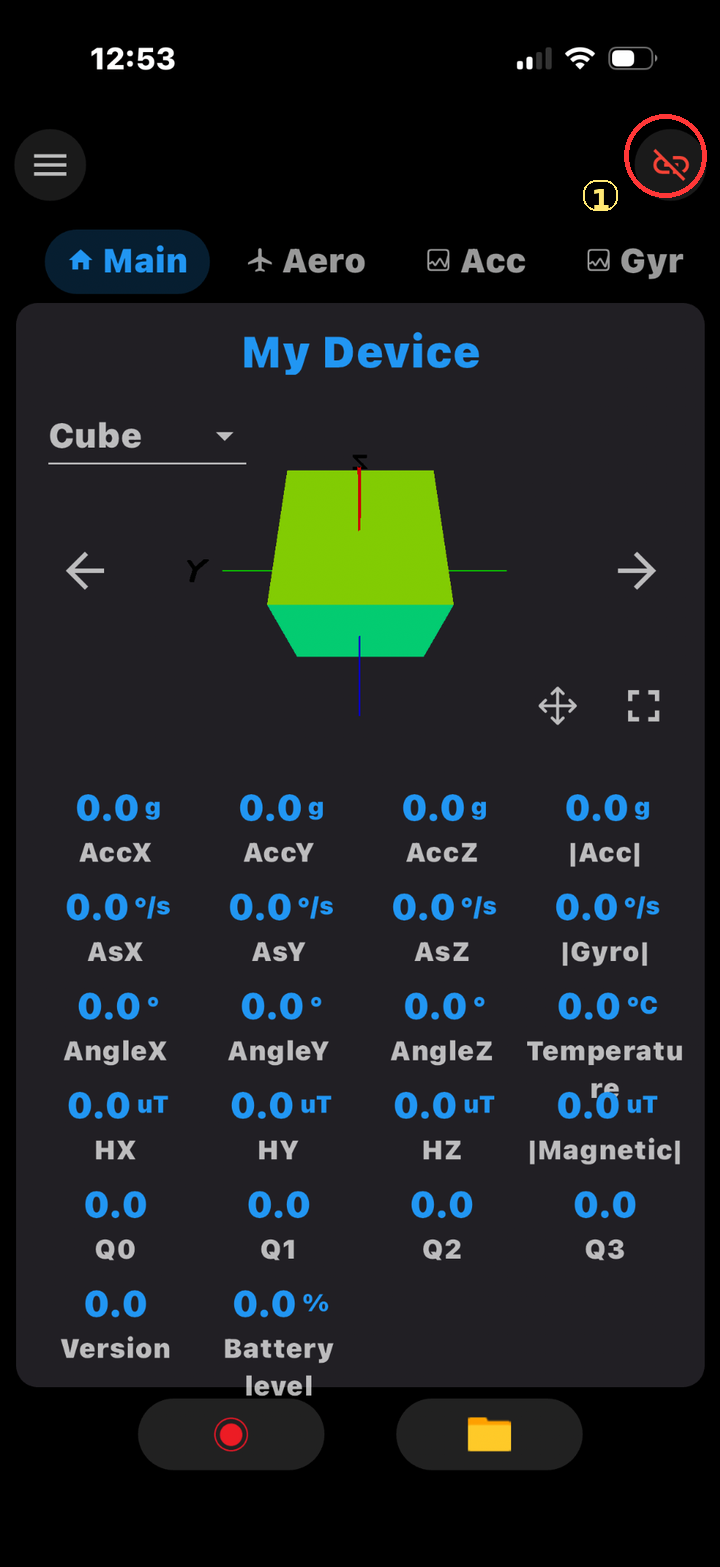
Tap the chain/link icon to open the connection screen.
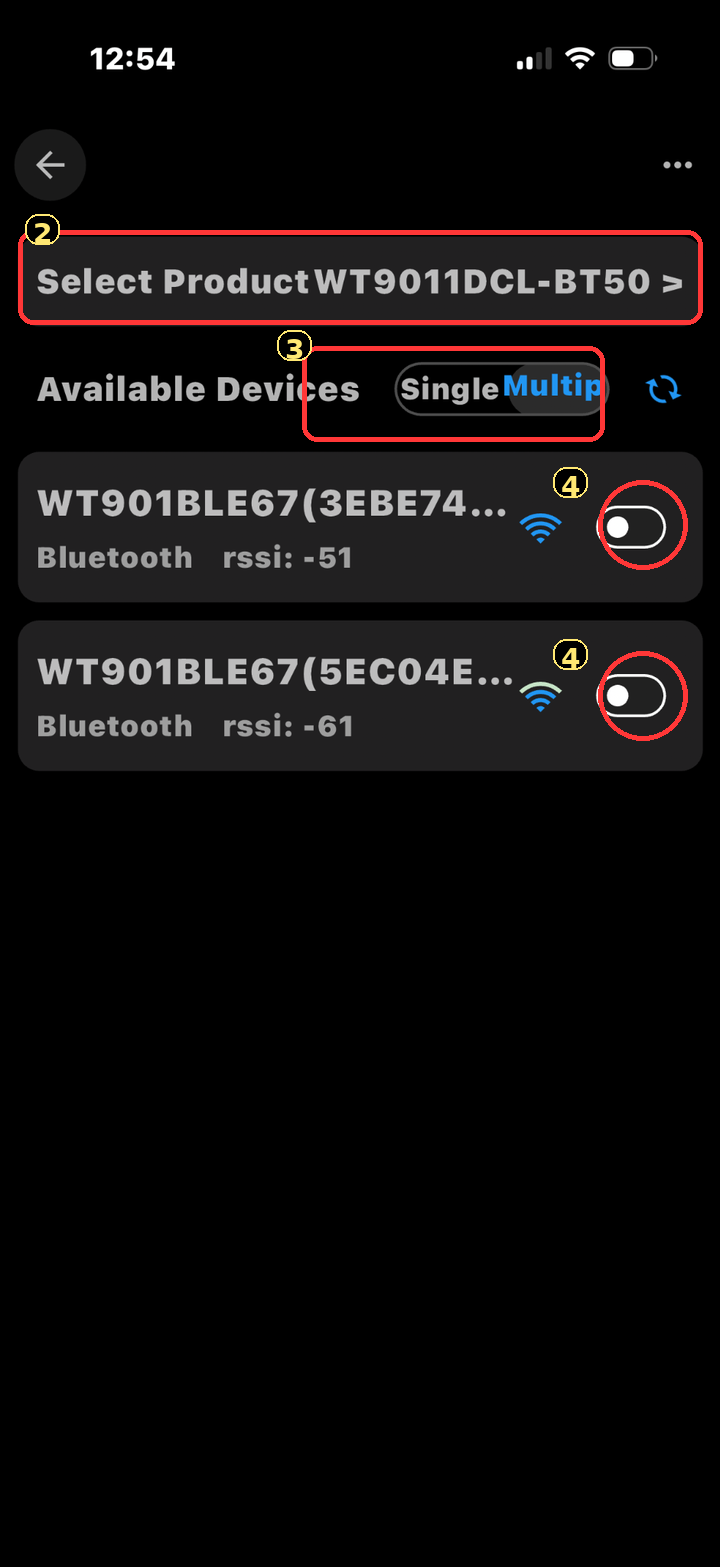
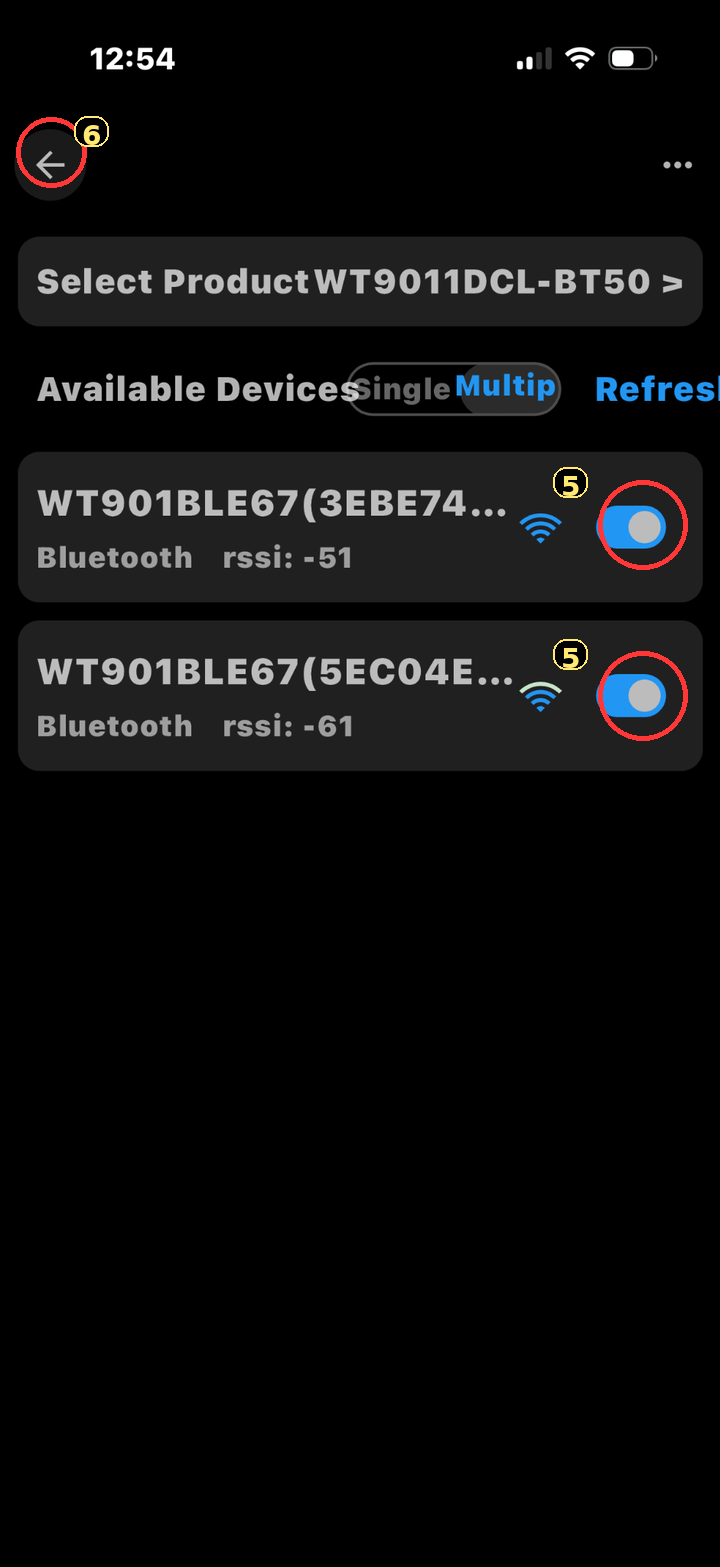
Confirm the product type, switch to Multip, then connect both of your sensors by name/address.
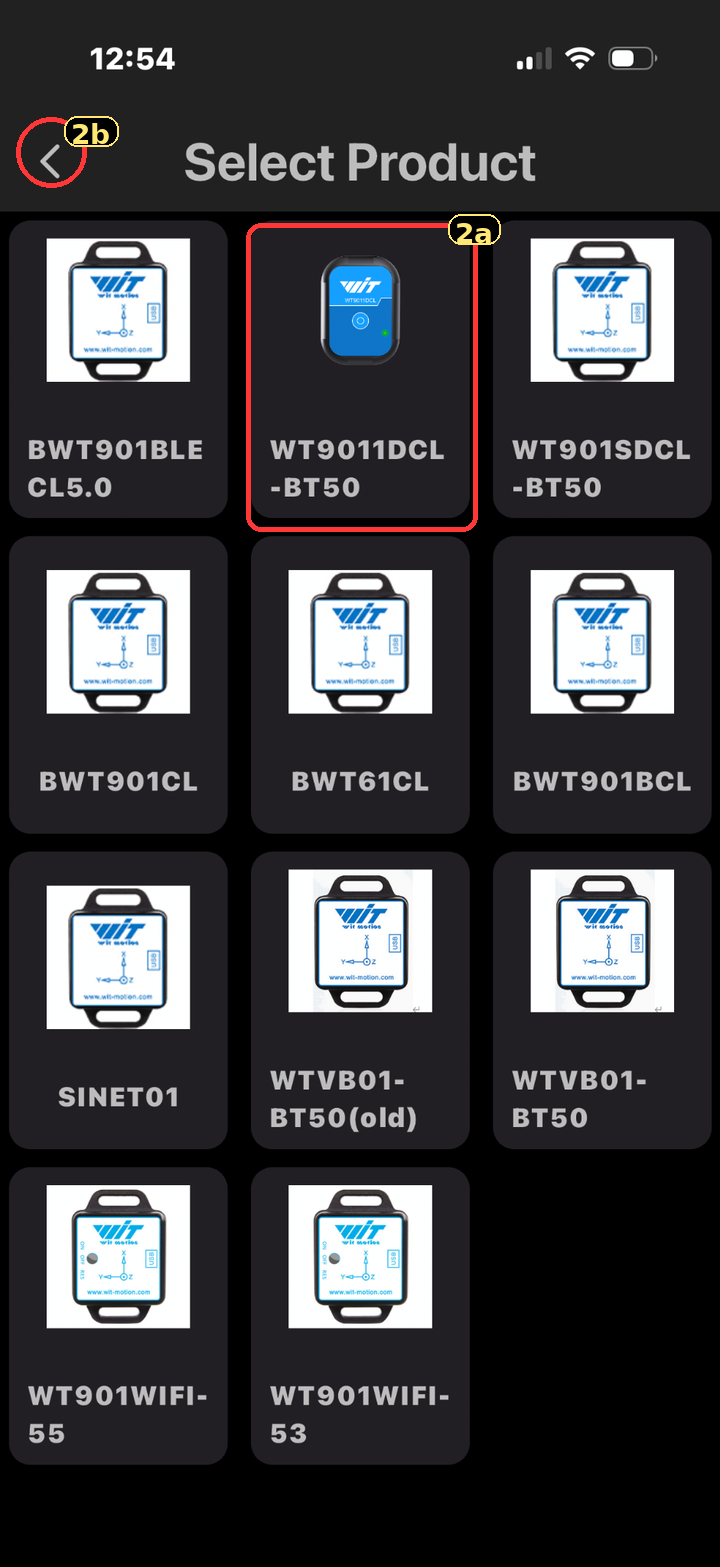
Only use this if the product bar is not already correct. Pick the WitMotion model, then go back.
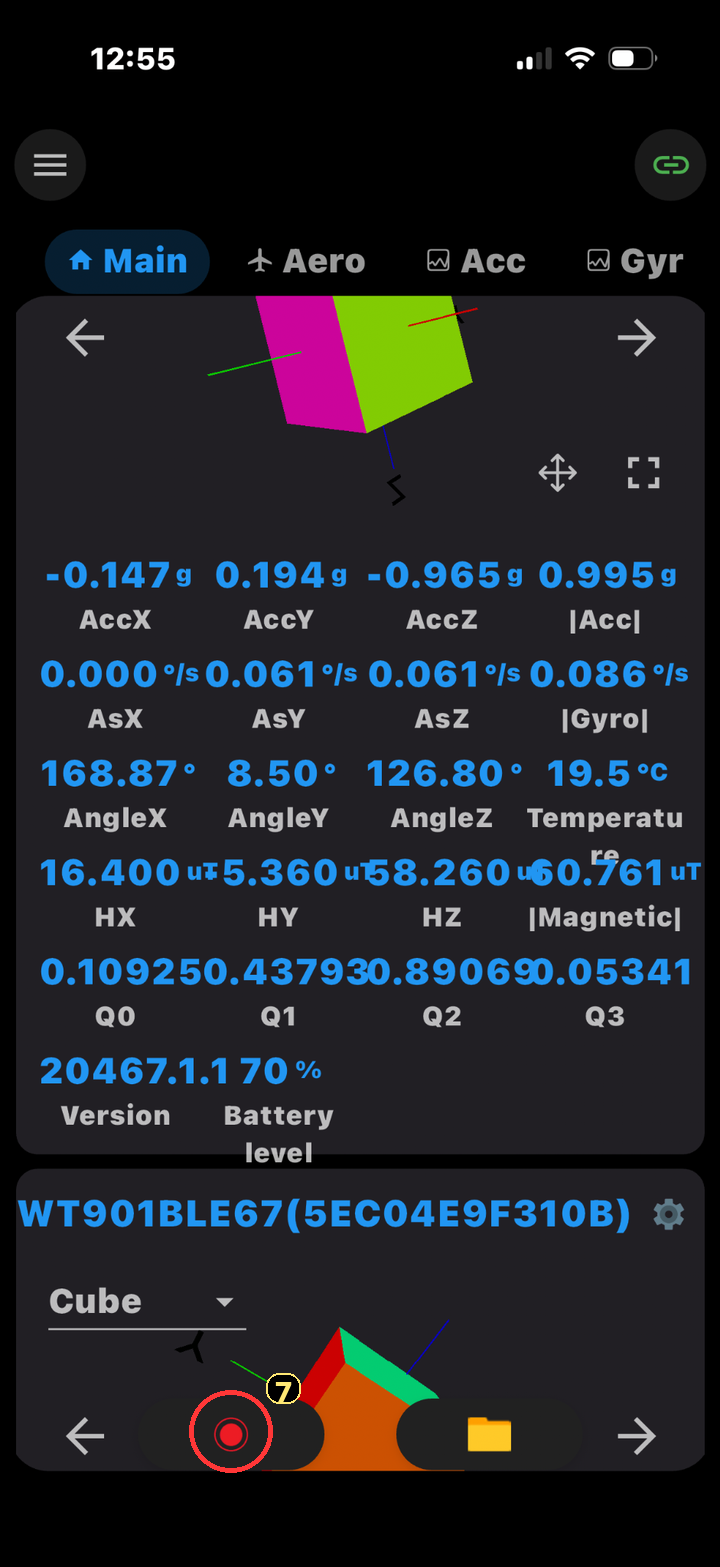
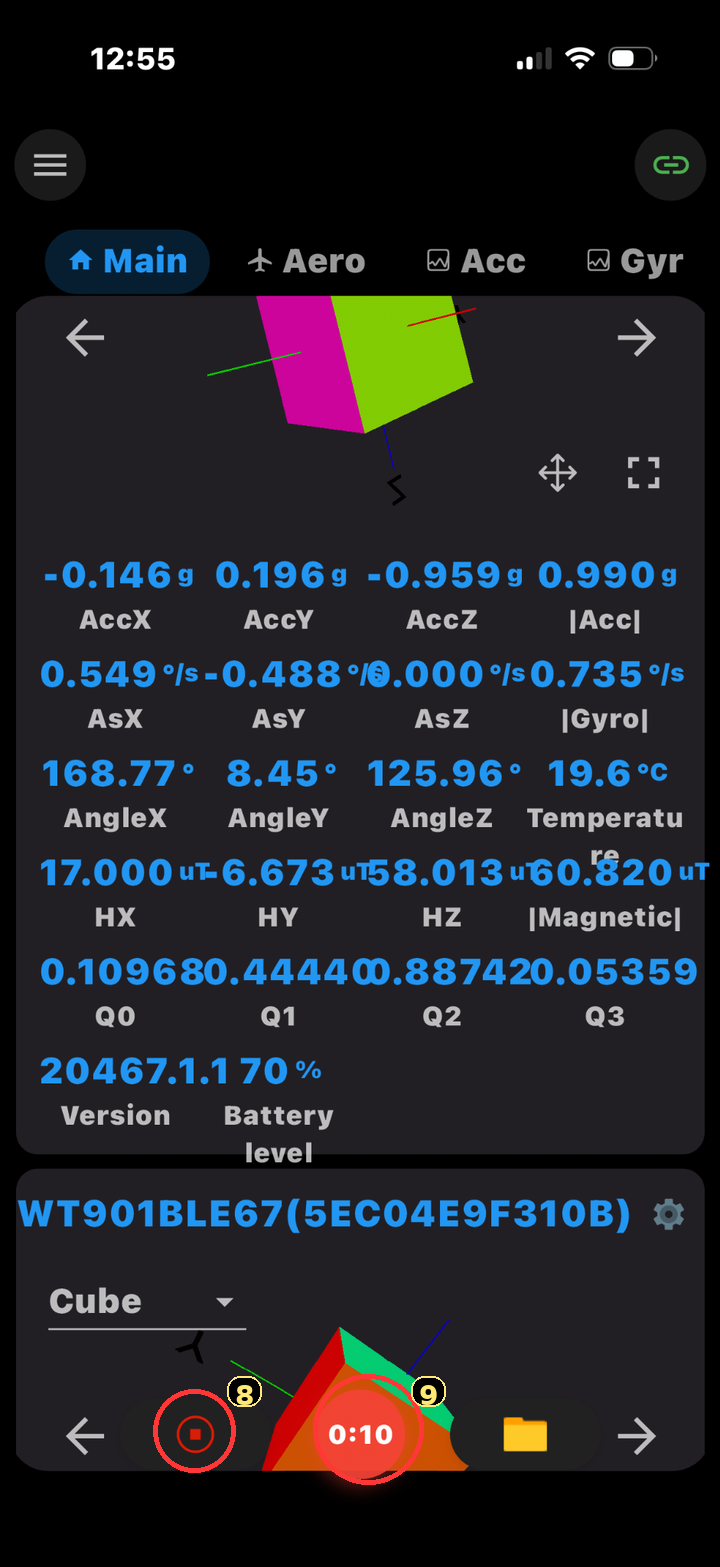
Verify live values, start recording, stop, then open the folder.
Connect / pair the sensors
- Start on the Main screen. This is the first screen users should see. Tap the chain/link icon near the top right to open the sensor connection screen.
- Check the product type. On the Available Devices screen, use the Select Product… bar if the displayed model is wrong. In these screenshots, WT9011DCL-BT50 is selected.
- Return from Select Product. After choosing the product, use the back arrow to return to Available Devices.
- Use multiple-sensor mode. Tap Multip if you are recording two sensors.
- Connect your sensors. Tap the switch beside each of your sensor names. If other WitMotion sensors are nearby, compare the visible names/addresses to the last 3–4 characters/digits you wrote down at home.
- Return to Main. Use the back arrow and confirm live Acc/Gyr/Angle numbers are changing. If both sensor cards are shown, swipe between them and check both before recording.
Start and stop recording
- Verify live data first. On Main, move each sensor slightly and confirm the values change.
- Start recording. Tap the red record circle. Start a few seconds before rowing so the file includes a clean beginning.
- Keep the app active while recording. The timer means recording is running. Avoid disconnecting Bluetooth or force-closing the app during the row.
- Stop recording. Tap the stop square. Then tap the folder icon to open saved recordings.
Find, export, and upload the recording
- Open saved recordings. Tap the folder icon on Main, then open the folder named with the date/time of the row. The date/time naming makes the correct recording fairly easy to identify.
- Use the
.txtfile. The text file contains the data table with time, DeviceName, Acc, Gyro, Angle, magnetic field, quaternion, temperature, version, and battery columns. - Check that both sensors are present. In a two-sensor recording, the DeviceName column should include both of your sensor IDs somewhere in the file.
- Export/share the file from the app. Open the date-named recording folder, select the
.txtfile, and use the share icon to send it to yourself, save it to cloud storage, or move it to the computer used for upload. - Upload to Cloud Analysis. Upload the
.txtfile. If the uploader asks for a zip file, zip the whole timestamped recording folder and upload that zip.
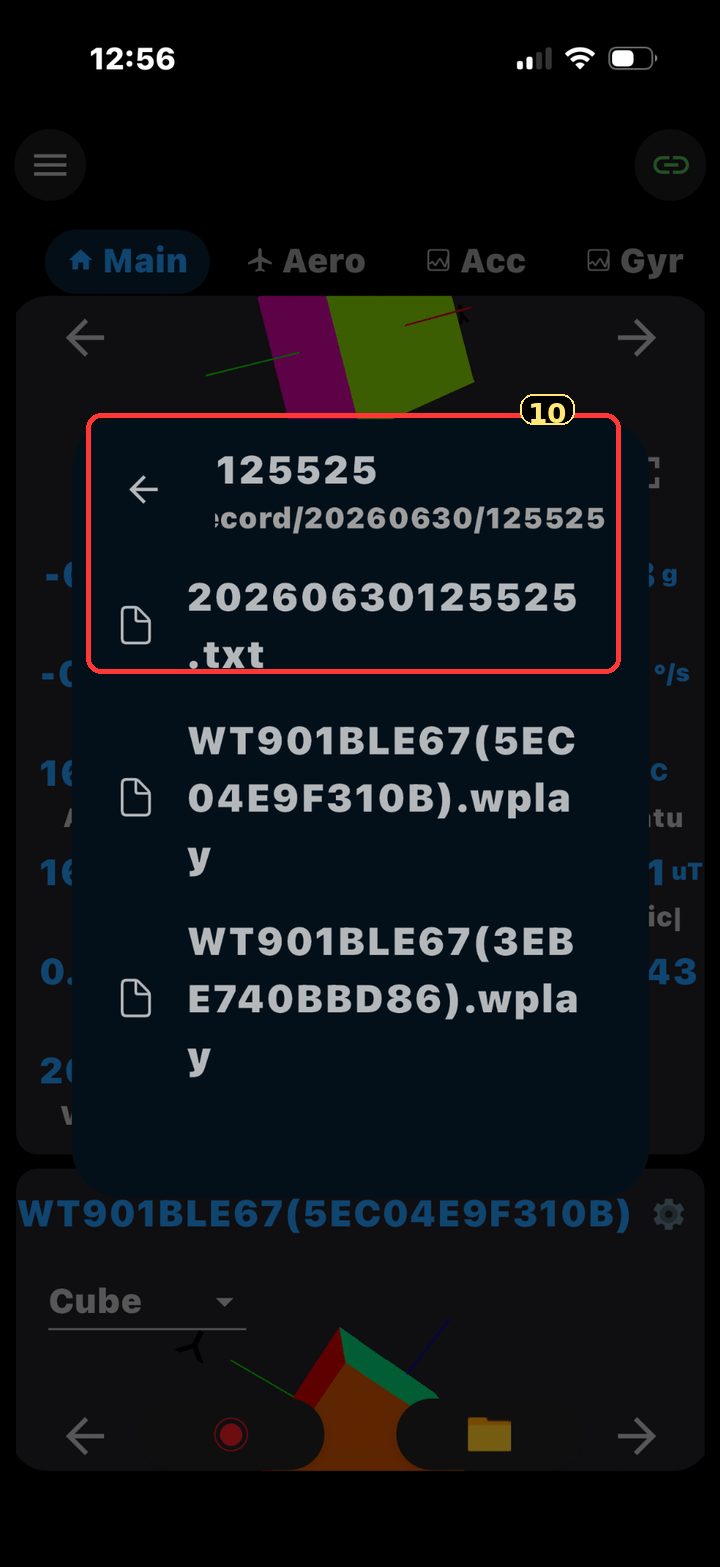
.txt file; the .wplay files are not the main upload file.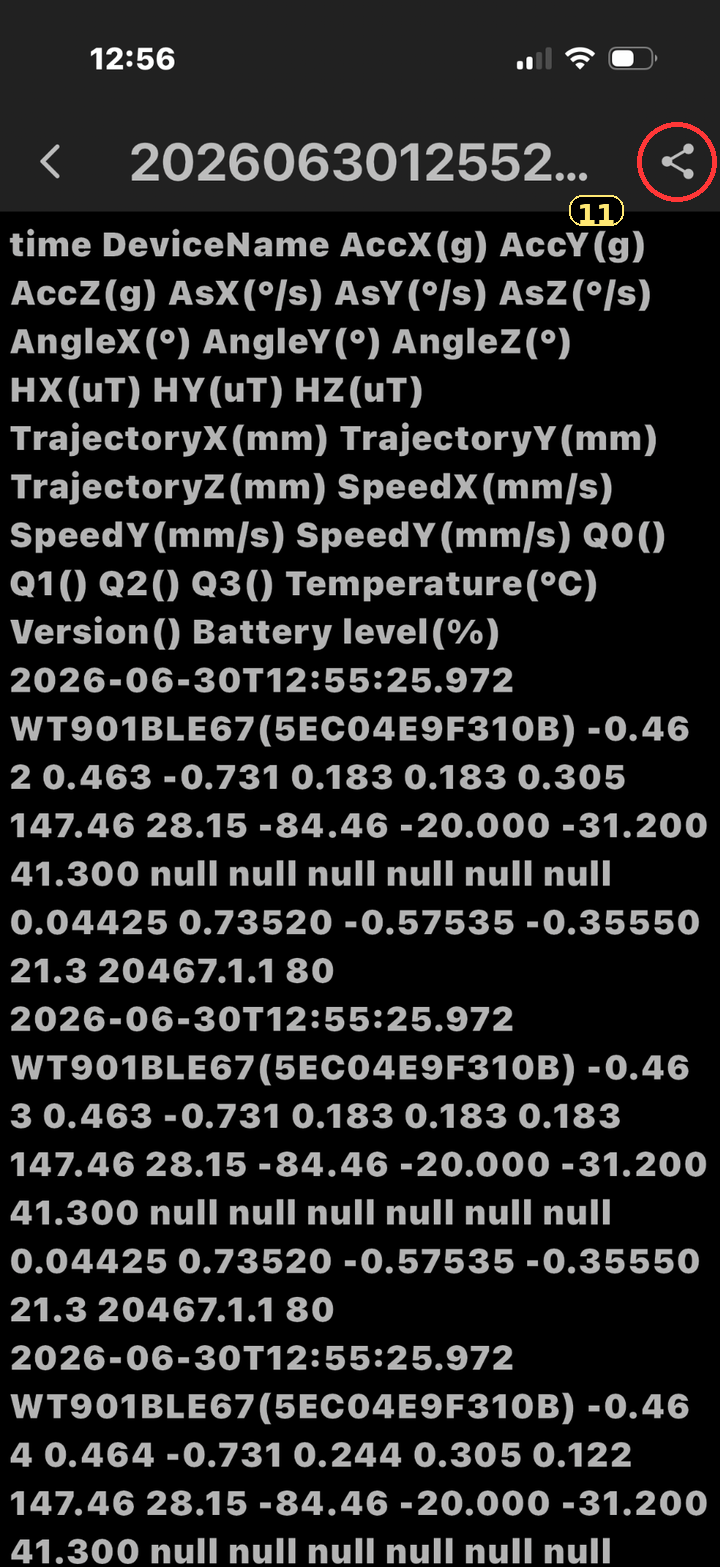
Common problems
- No sensors appear: make sure the sensors are on and close to the phone, then tap refresh. Android may also require Bluetooth and location permission for BLE scanning.
- Only one sensor connects: switch to Multip, then turn on both sensor switches again.
- Values are not changing: return to the connection screen and reconnect the sensor before recording.
- Several nearby sensors appear: use the last 3–4 characters/digits of your sensor addresses that you wrote down at home so you only connect to your own sensors.
- Finding the recording: tap the folder icon in the app and use the date/time-named recording folder. Then share the
.txtfile directly from the app.
Connecting Oar Sensors
Use this page to connect the RitmoForceCurve iOS app to the two Bluetooth oar sensors before a row. The safest routine is: power the sensors, connect them deliberately, turn on Autoconnect, then leave the Bluetooth menu.
Start from the Home screen
- Turn on both oar sensors before opening the Bluetooth connection screen.
- Open RitmoForceCurve.
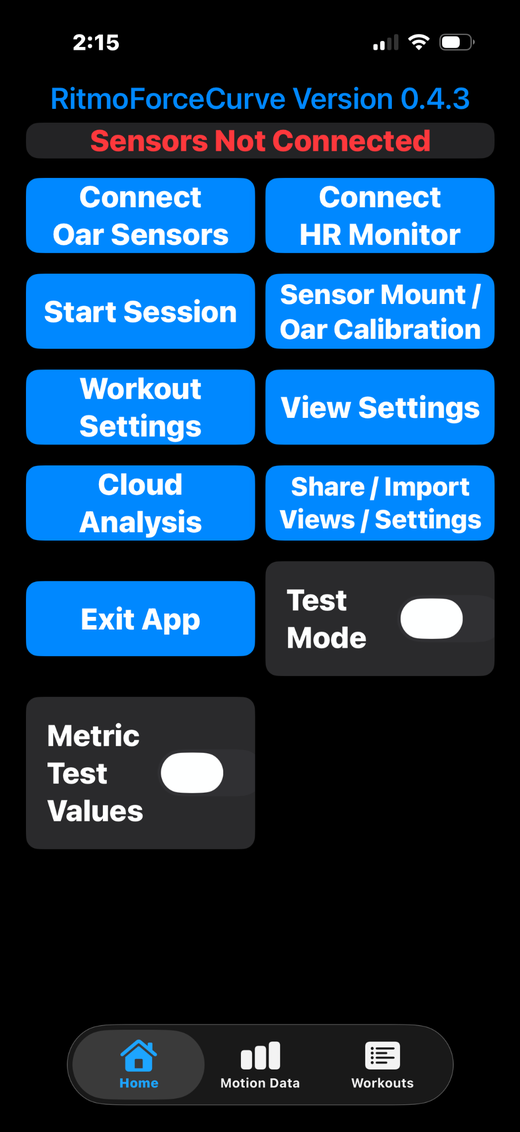
- If the status says Sensors Not Connected, tap Connect Oar Sensors.
- If the status says Searching for Previous Sensors for more than a few seconds, also tap Connect Oar Sensors and do a clean connection.
Do not start a rowing session until the Home screen says Sensors Connected.
Use a clean start when pairing or when things seem confused
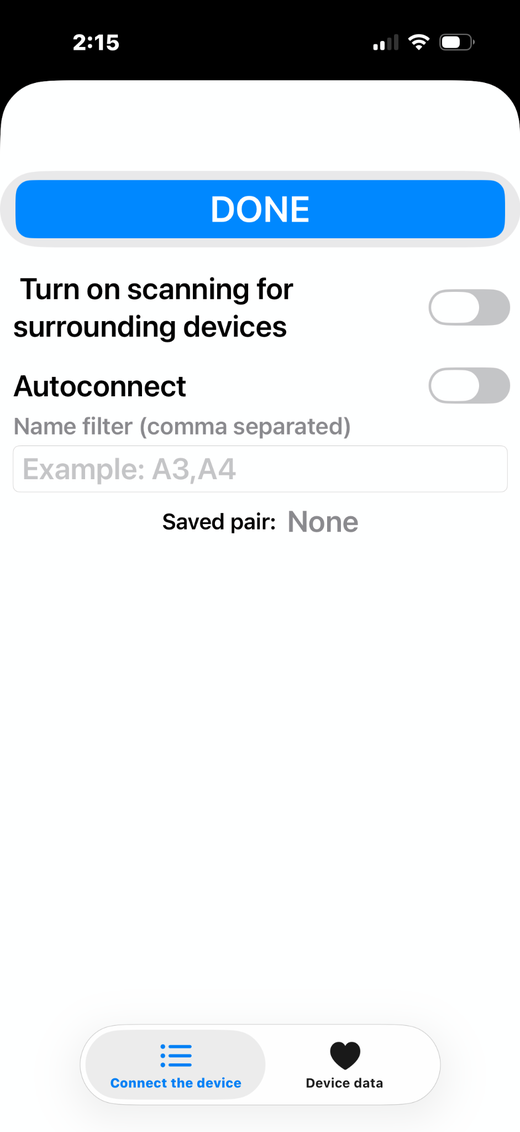
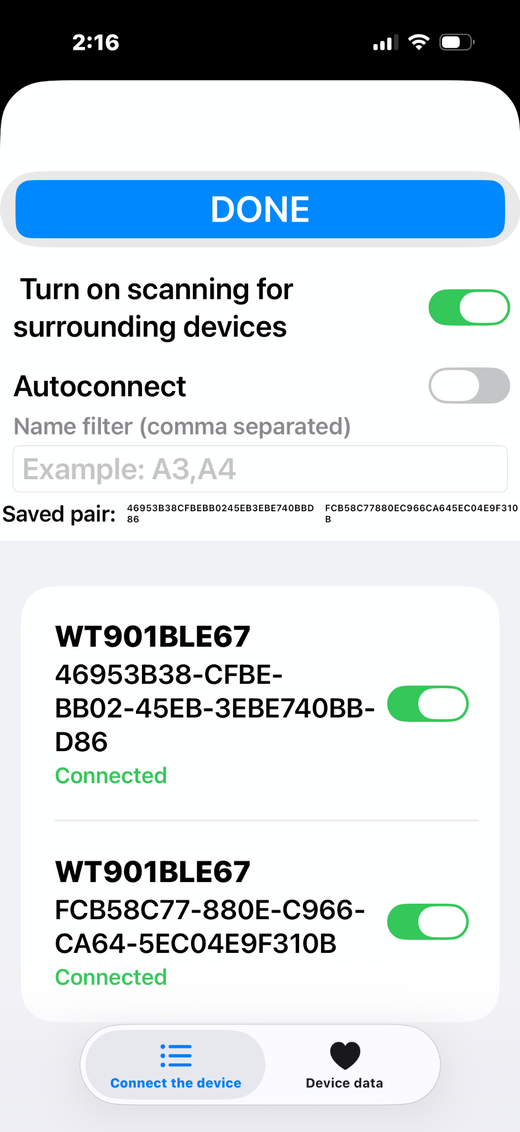
- In the Bluetooth menu, start with Turn on scanning for surrounding devices turned off.
- Start with Autoconnect turned off.
- If any individual sensor switch is already on and you are not sure it is yours, turn it off before continuing.
This prevents the app from grabbing an old saved pair or a nearby sensor before you have confirmed the two sensors you want.
Turn scanning on and connect your two sensors
- Turn on Turn on scanning for surrounding devices.
- Wait for the two WT901BLE67 sensors to appear.
- If you already set up Autoconnect at home, the app should connect only to the saved pair. If you are setting up for the first time at a busy dock, move away from other sensors if possible, or connect where only your two sensors are nearby.
- Turn on the switch for each of your two sensors.
- Both sensors should show Connected.
At this stage, the app just needs the correct two sensors. You do not have to decide which one is shaft or sleeve from the Bluetooth name.
Turn Autoconnect on before leaving the Bluetooth menu
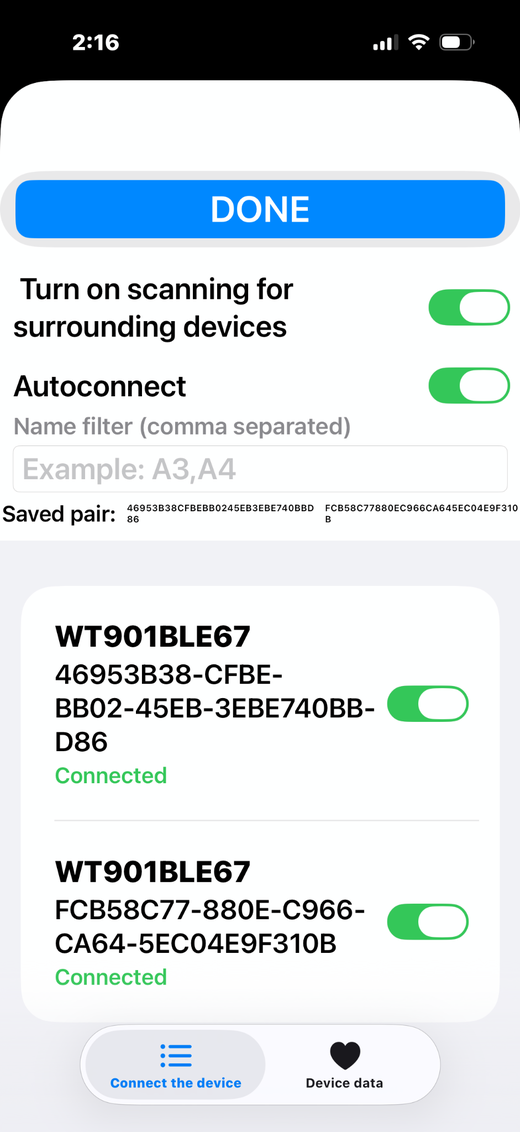
- After both sensors show Connected, turn Autoconnect on.
- Then tap DONE.
Turning Autoconnect on at this point tells the app to save this pair. Next time, with these sensors powered on, the app will search for the saved pair instead of asking you to pick from every nearby Bluetooth sensor.
Normal launch after a saved pair exists
- Turn on the two oar sensors first.
- Open RitmoForceCurve.
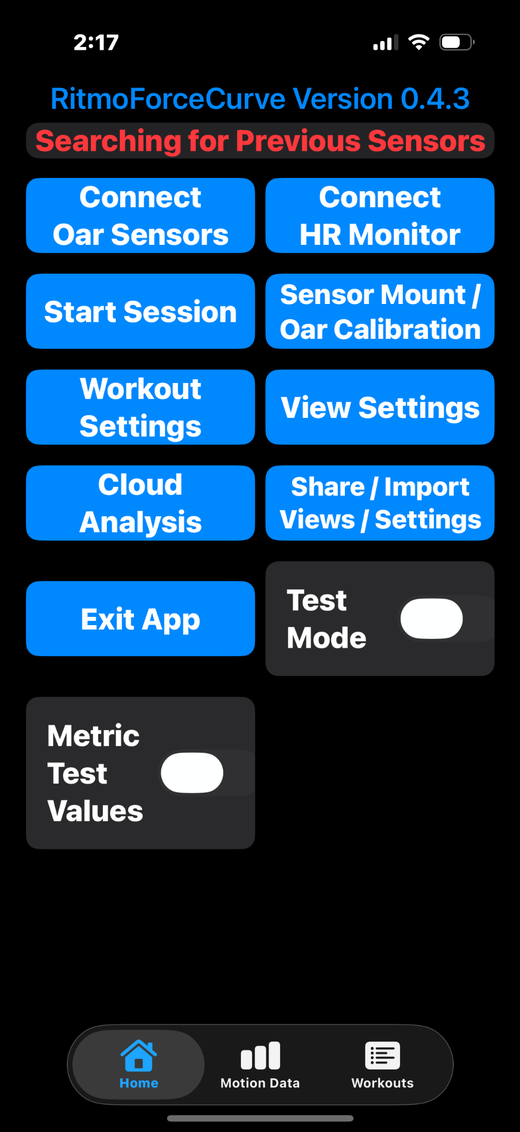
- The Home screen may say Searching for Previous Sensors while the app looks for the saved pair.
- Wait a few seconds. If the sensors are on and nearby, the status should change to Sensors Connected.
If it keeps searching, tap Connect Oar Sensors and repeat the clean-start process above.
Confirm connection before rowing
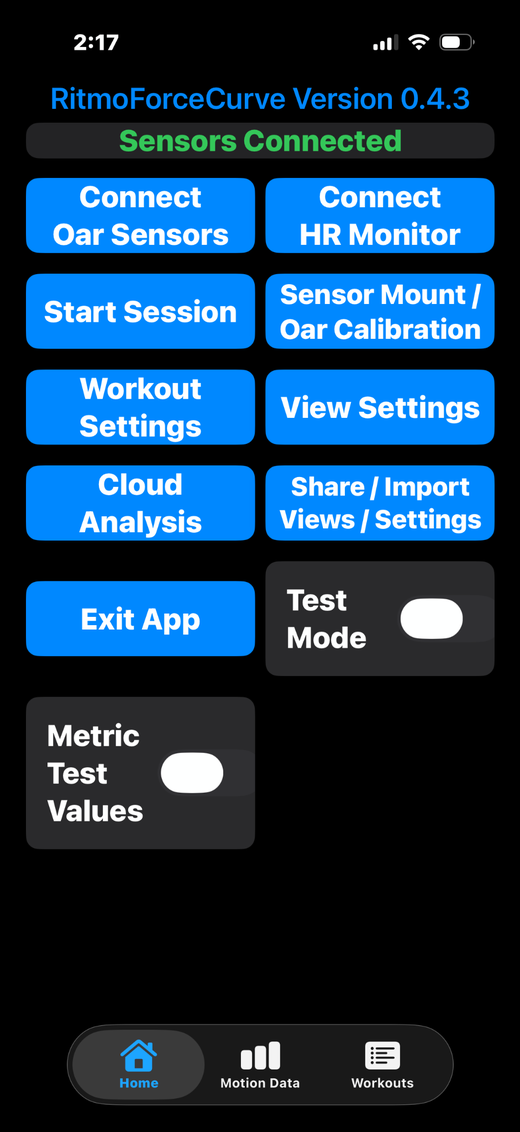
- Look for Sensors Connected on the Home screen.
- Go to Sensor Mount / Oar Calibration if you need to check side, mount orientation, or calibration.
- When everything looks correct, tap Start Session.
Troubleshooting
Turn scanning off and back on, move the phone closer, or power-cycle the missing sensor.
Turn Autoconnect off, move away from other sensors if possible, connect only your two sensors, then turn Autoconnect back on before DONE.
Open Connect Oar Sensors, turn scanning and Autoconnect off, then reconnect both sensors and turn Autoconnect back on before DONE.
Close the other app or disconnect the sensors there, then scan again.
Workout & Auto Timer Settings
These settings control how the app interprets rowing data, detects pieces, summarizes workout history, and adjusts oar-derived power values.
Auto Piece Timer
The Auto Piece Timer, or APT, is an algorithm that automatically determines when the rower is doing a piece versus taking rest strokes. This lets a separate piece timer start and stop without the rower pressing start, ready, or stop during the workout.
In the current app, the trigger can be based on Rate, Power, Both, or Either. The older description based only on stroke-rate threshold still applies when APT Trigger is set to Rate, but the new app also supports power-based piece detection.
The algorithm confirms the start of a piece after repeated qualifying strokes. It ends the piece retroactively when strokes no longer meet the trigger criteria or when the inactivity time exceeds the Auto Piece Time Cutoff, so the inactive time is not counted as part of the piece.
APT Settings
| Setting | What it does |
|---|---|
| APT Trigger | Chooses how the app decides that a piece has started. Options are Rate, Power, Both, and Either. |
| Rate Threshold | The stroke-rate threshold used when APT Trigger includes rate: Rate, Both, or Either. |
| Power Threshold | The power threshold used when APT Trigger includes power: Power, Both, or Either. |
| Min Distance | Removes very short detected pieces from the piece list and workout summary. This is useful for excluding short warmups, drill segments, or accidental starts. |
| Auto Piece Time Cutoff | The amount of inactivity time used to determine that a piece has ended. The logic works retroactively so the inactive time is not counted as part of the piece. The current algorithm also ends a piece after repeated non-qualifying strokes. |
| Piece Rounding | Choose whether pieces are summarized by distance or time. |
| Distance Rounding | When Piece Rounding is set to Distance, choose the distance increment used to round piece summaries. |
| Time Rounding | When Piece Rounding is set to Time, choose the time increment used to round piece summaries. |
Workout Settings
| Setting | What it does |
|---|---|
| Boat Class | Sets the boat class used in workout metadata and titles. Current options include 1x, 2x, 2-, 4x, 4-, 4+, and 8+. |
| Speed Cutoff | Removes data assumed to be inactive so average speed, stroke rate, and heart rate better represent time actually rowing. |
Oar Setup settings on this screen
| Setting | What it does |
|---|---|
| Side | Selects Port or Starboard so the app interprets the oar motion in the correct direction. |
| Oar Type | Selects Scull or Sweep. This is connected to the chosen boat class. |
| Scale Factor | Scales measured oar bend into force-related values. It affects force, work, power, and power split, but not the shape of the force curve. |
Placeholder: add screenshots of the current Workout Settings screen and examples showing how different APT settings change detected pieces.
Sensor Mount / Oar Calibration
The app button is Sensor Mount / Oar Calibration. It includes a simple sensor mount-angle check plus the tools used to choose, edit, manage, share, and create oar calibrations.
In-app tabs
The Sensor Mount / Oar Calibration screen has four in-app tabs. The first tab is only a mounting-angle check. The other three are used to select, edit, manage, share, or create oar calibrations.
| App tab | Use it for |
|---|---|
| Mnt Ang check | Check whether the two sensors are mounted at a reasonable angle. This is separate from Scale Factor calibration. |
| Calib - sel/edit | Select the active calibration, edit dimensions or calibration values, scan an oar label, and save changes. |
| Calib - manage | Import, export, delete, select, label, and share saved calibrations. |
| Calib - create | Create a calibration from a known-weight bend test. Many rowers may never need this tab. |
Sharing Views, Settings & Calibrations
RitmoForceCurve includes separate sharing tools for live workout views, workout settings, and oar calibrations. The sharing method depends on what you are trying to move to another phone, rower, or boat.
Where to start in the app
| What you want to share | Where in the app | Best method |
|---|---|---|
| Custom live metric views | Home → Share / Import Views / Settings | Generate share text, then use Share or Copy to Clipboard. |
| Workout settings | Home → Share / Import Views / Settings | Include workout settings in the generated share text. |
| Oar calibrations | Sensor Mount / Oar Calibration → Calib - manage | Export/import CSV, create label PDF, or scan a QR label. |
Share custom views and workout settings
From the Home screen, tap Share / Import Views / Settings. The app then asks whether you want to share or import.
- Choose Share Views / Settings.
- Select which saved custom views to include.
- Choose whether to include current workout settings.
- Optional: enter a short prefix. The prefix is added to imported view names on the receiving phone, which can help identify a coach/team/rower source.
- Tap Generate Share Text.
- Use Share or Copy to Clipboard to send the generated text.
Import custom views and workout settings
- From the Home screen, tap Share / Import Views / Settings.
- Choose Import Views / Settings.
- Paste the shared text into the import box.
- Tap Read Import Text.
- Choose whether it is OK to import views, import settings, and make imported views active.
- Complete the import after reviewing the preview.
Imported view names can include the sender’s prefix. This helps avoid confusion when your own views and someone else’s shared views are both present.
Share oar calibrations
Oar calibrations are handled separately from live view/settings sharing because calibrations contain oar geometry, sensor locations, calibration values, and Scale Factor information.
- Open Sensor Mount / Oar Calibration.
- Go to Calib - manage.
- Use Export CSV to share calibration records as a file, or Import CSV to bring them onto another phone.
- Use Create Label PDF to print labels for selected calibrations.
- Use Scan Label to read a QR label and add or update a saved calibration.
Label PDFs are useful when a calibration belongs to a specific oar. The printed label can stay with the oar, and another phone can later scan the QR code to recover the calibration.
Open calibration sharing instructionsWhat is included
| Shared item | Typical contents |
|---|---|
| Custom views | Saved view names, templates, slot choices, and selected metrics. |
| Workout settings | Oar setup values, Auto Piece Timer settings, rounding settings, boat class, and speed cutoff. |
| Calibration CSV / QR label | Calibration name, rig, side, S1/S2, load/support points when present, inboard, outboard, length, Cperm, Scale Factor, and shaft-profile information. |
Creating Custom Views
Custom views let you create live workout screens using the metrics and layout that are most useful for the rower or coach.
Basic custom-view flow
- Choose a view template.
- Name the new view.
- If using the Grid template, choose the grid layout size.
- Tap a slot in the preview to change the metric shown there.
- Select a metric from the available GPS, oar, and time categories.
- Save the view, then activate it if you want it available during workouts.
Current templates
- LMPlot — a live-metric layout with larger top fields and supporting metrics below.
- BPlot — another live-metric layout with header, middle, and bottom metric positions.
- Grid — a configurable grid of live metrics.
Editing existing views
Existing custom views can be renamed, adjusted by tapping metric slots in the preview, and deleted when no longer needed.
Placeholder: add screenshots for choosing a template, naming a view, tapping a metric slot, selecting a metric category, and activating the finished custom view.
Data & Metrics Guide
Definitions for the GPS, oar-derived, and time-based measurements shown in the RitmoForceCurve app. The names and abbreviations below are aligned to the current Swift metric labels used in the app.
GPS metrics
These values are derived from GPS/location distance and speed.
| Metric | App label | App name | Description |
|---|---|---|---|
| Distance | dist. | Distance | Total distance recorded for the workout or selected interval, shown in meters. |
| 500m Split | split | 500mSplit | Current pace expressed as time per 500 meters. This is calculated from GPS speed and shown as minutes:seconds. |
| Piece Avg Split | pAvgS | pieceAvgSplit | Average 500m split for the active piece, calculated from piece distance divided by piece elapsed time. |
| Piece Distance | pDist | pieceDistance | Distance covered during the current detected piece, shown in meters. |
| Speed | speed | speed | Current GPS speed, shown in meters per second in data/detail views. For rowing pace, the app usually displays 500m split instead. |
Oar metrics
These values come from oar motion and oar-bend measurements from the sensor kit.
| Metric | App label | App name | Description |
|---|---|---|---|
| Power | pwr | Power | Force-curve-derived rowing power. It is scaled by the workout scale factor, so changing scale factor changes Power, Work, and pSplit values. |
| Max Bend | maxBnd | maxBend | Maximum oar-bend value during the drive, derived from the difference in rotation measured by the sensors on the oar. |
| Power Split | pSplit | powerSplit | Effort-based split derived from oar work/power rather than GPS boat speed. It is meant to track rowing effort, so it can differ from GPS split in wind, current, or other conditions. |
| Stroke Length | strLen | strokeLength | Arc length of the drive, measured from when oar bend first reaches about 5% of max bend to when it falls back to about 5% near the finish. It excludes Catch Miss and Finish Miss. |
| Catch Miss | catchM | catchMiss | Stroke arc missed at the beginning of the drive, from the fully squared blade moving sternward until about 5% of max bend has developed. |
| Finish Miss | finishM | finishMiss | Stroke arc missed at the finish, from when oar bend drops to about 5% of max bend until the blade starts to feather. |
| Ratio | ratio | Ratio | Stroke duration divided by drive time. Drive time is based on the Stroke Length interval and does not include Catch Miss or Finish Miss. |
| Max Oar Rotation Speed | maxRot | max oar rotation speed | Maximum rotational speed of the oar during the drive. |
| Work During Drive | drivework | work during drive | Work done by the rower during the drive portion of the stroke. |
| Percent Stroke Length at 50% Work | midWork | percent Stroke Length at 50% work | Where the median of work distribution occurs, expressed as a percentage of stroke length. Less than 50 means the work distribution is more front-loaded. |
| Percent Stroke Length at Max Bend | maxBper | percent Stroke Length at maxBend | Where Max Bend occurs, expressed as a percentage of stroke length. |
| Max Force | MaxF | Max Force | Maximum scaled force value shown in workout detail views. It is closely related to Max Bend but displayed as a force value after scaling. |
Time metrics
These values come from workout timing, piece timing, stroke timing, and heart-rate data.
| Metric | App label | App name | Description |
|---|---|---|---|
| Workout Time | wTime | WorkoutTime | Elapsed time since the start of the workout, shown as hours:minutes. |
| Piece Time | pTime | pieceTime | Elapsed time during the current detected piece, shown as minutes:seconds. |
| Stroke Rate | SR | strokeRate | Stroke rate in strokes per minute. The app can show half-rate increments using a small “1/2” marker. |
| Heart Rate | HR | heartRate | Heart rate in beats per minute when heart-rate data is available. |
| Time | Time | Time | Elapsed time shown in workout totals and detail tables for a session, active rowing, piece, or selected stroke group. |
Scale Factor discussion
Scale Factor is not a separate metric. It is the multiplier used to convert measured oar bend into force. Because the system is treated as linear, this one number accounts for oar stiffness, sensor spacing, and sensor placement relative to the pin.
Changing Scale Factor changes the magnitude of effort-related values such as Force, Work, Power, and pSplit. It does not change the force-curve shape or metrics that do not depend on force magnitude, such as Ratio, Catch Miss, Finish Miss, midWork, maxBper, Stroke Length, GPS distance, GPS split, or Stroke Rate.
The goal of calibration is to make effort-based values comparable across different oars and sensor mounts. A more accurate Scale Factor helps a rower compare total effort, work per stroke, power, and power split from session to session or between setups.
Force Curve Physics
A practical explanation of force, work, and power as they relate to oar bend, force curves, drive work, and rowing power.
Force: how hard the rower pulls on the handle
In everyday rowing language, when someone says “she has a powerful stroke,” they often mean that she has a forceful stroke. They are usually talking about how hard she loads the handle, oar, and blade during the drive.
Force by itself is not the same thing as work or power. During a normal rowing stroke, a very high early force peak can feel impressive, but the rower still needs to carry useful force through distance. If the stroke is short, or if force rises sharply and then decays quickly, the force curve may be forceful without producing as much drive work as a curve that applies useful force through more of the stroke arc.
The missing ingredient is distance. In rowing terms, the rower needs to pull on the handle while the oar rotates through the drive angle. Force creates rowing work only when it is applied through movement.
Example: force with no rowing work and no power
Imagine a rower sitting at the catch at the start of a race. The boat is held firmly by the starting equipment at the bow. Now also imagine pilings in the water right at the buried blade so that, if the rower applies force, the blade and oar cannot rotate around the pin. The oar may bend like a spring, but it does not sweep through the water.
Now remove the piling so the oar is allowed to move. As the rower keeps force on the handle and the oar rotates through the drive, work can be done. This is the key distinction: applying force through distance, or applying moment through oar angle, creates drive work.
Work: force applied through distance
Linear work is force multiplied by distance in the direction of motion. In simple form:
Around the oarlock, the motion is better described as angular motion. The rower applies a force at the handle/blade system that creates a moment, or torque, about the pin. As the oar rotates through the drive angle, angular work is done:
In words: add up the oar moment over each tiny bit of stroke angle. If the force is high but the oar does not rotate, there is no drive work through the pin. If the oar rotates through the drive while loaded, the rower is doing work.
This is why the area under a force curve matters. A tall force peak can look impressive, but total drive work depends on both the magnitude of the force and how it is distributed through the drive length or drive angle.
Power: how quickly work is done
Power is work divided by time:
In rowing, this means that power depends on both work per stroke and stroke rate. Two strokes can do the same amount of drive work, but the rower producing that work more often is producing more average power.
Same drive work at 20 vs. 30 strokes per minute
Suppose the rower does 500 joules of drive work each stroke. At 20 strokes per minute, average power is:
At 30 strokes per minute with the same 500 joules per stroke:
The work per stroke is the same, but the higher rating produces more power because more work is being done per unit time.
There is also instantaneous power during the drive, which depends on how quickly work is being done at each point in the stroke. The app’s rowing power is most useful as an effort-based summary of how much work is being done over time.
How this relates to the force curve
The force curve is a picture of how the rower loads the oar through the drive. RitmoForceCurve uses two sensors on the oar to measure the difference in rotation between sensor locations. That difference is related to oar bend. With calibration, measured bend can be scaled into force or moment magnitude.
A force curve helps answer questions such as: how quickly does the rower connect at the catch, where does maximum load occur, how long is force maintained, and how cleanly does the rower release at the finish? Work is related to the area under the force or moment curve through the drive angle.
Where Scale Factor fits
Scale Factor converts measured oar bend into force magnitude. A better Scale Factor makes effort-based values such as Force, Work, Power, and pSplit more comparable across oars, sensor locations, and sessions.
Scale Factor changes the magnitude of force-derived metrics. It does not change the shape of the force curve, the timing of the catch or finish, stroke length, ratio, or GPS-derived values.
Cloud Analysis
First, see a sample of the interactive workout report Cloud Analysis creates.
Open example workout reportCloud Analysis turns RitmoForceCurve workout data into an interactive, shareable HTML workout report.
Start Cloud Analysis
Use the Cloud Analysis web app to upload a recorded workout, queue the analysis, and download or open the finished report.
Open Cloud AnalysisHow it works
- Record the workout with the RitmoForceCurve mobile app.
- Upload the workout data package to Cloud Analysis.
- Choose or confirm the workout settings, then queue the analysis.
- The server processes the raw sensor and workout data and builds an interactive HTML report.
- The report can be opened in a browser, downloaded, or shared.
The report groups and averages strokes so you can compare changes in rate, power, stroke length, handle/oar speed, and force-curve behavior across pieces and intensity levels.
The Cloud Analysis dashboard also lets you review completed analyses, re-run an analysis while the raw data is still retained, download results, or delete older jobs.
Pricing
Current pricing for the RitmoForceCurve oar kit, iOS app, and Cloud Analysis.
Oar Kit
iOS App Subscription
Cloud Analysis
Coming Soon
- Coach's overlay cloud processing
- Coach's live metrics viewer